US Macroeconomic Data Explorer
Originally authored: 3 February 2020
Data last updated: 08 July 2023 - 01:15 UTC
The purpose of this project is to aggregate and disseminate publically available US macroeconomic data. Data APIs and web-scraping are used extensively.
All the results and plots presented in the pages below aim to be reproducible, referencing the primary-source data directly.
The following list contains automatically-updated interactive plots for each category. All content is generated by rendering the Jupyter notebooks into webpages. Automatic updates run once per week.
Charts
Retail Sales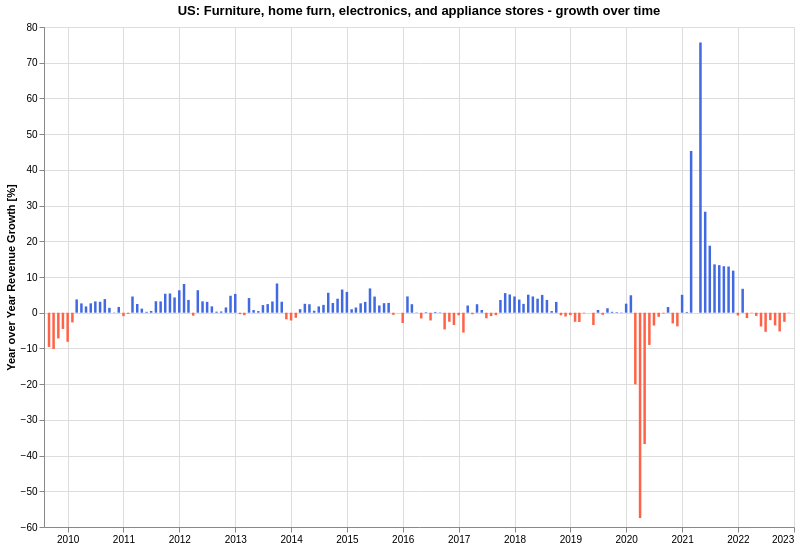
|
Credit Cards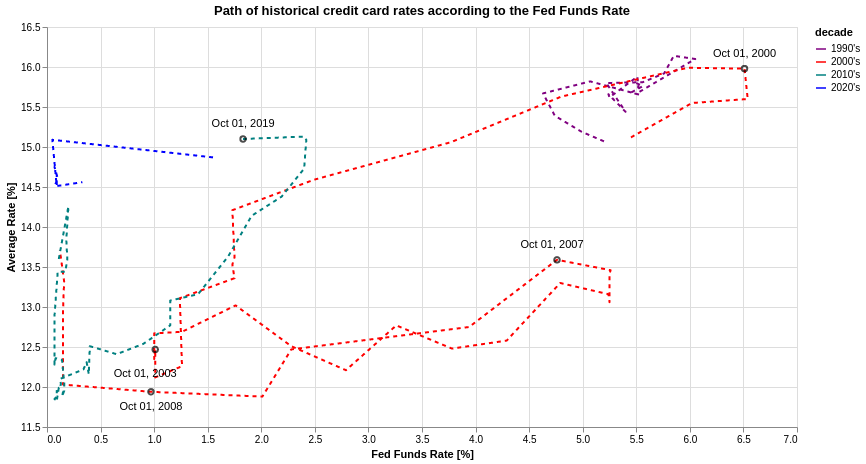
|
|
Service Sector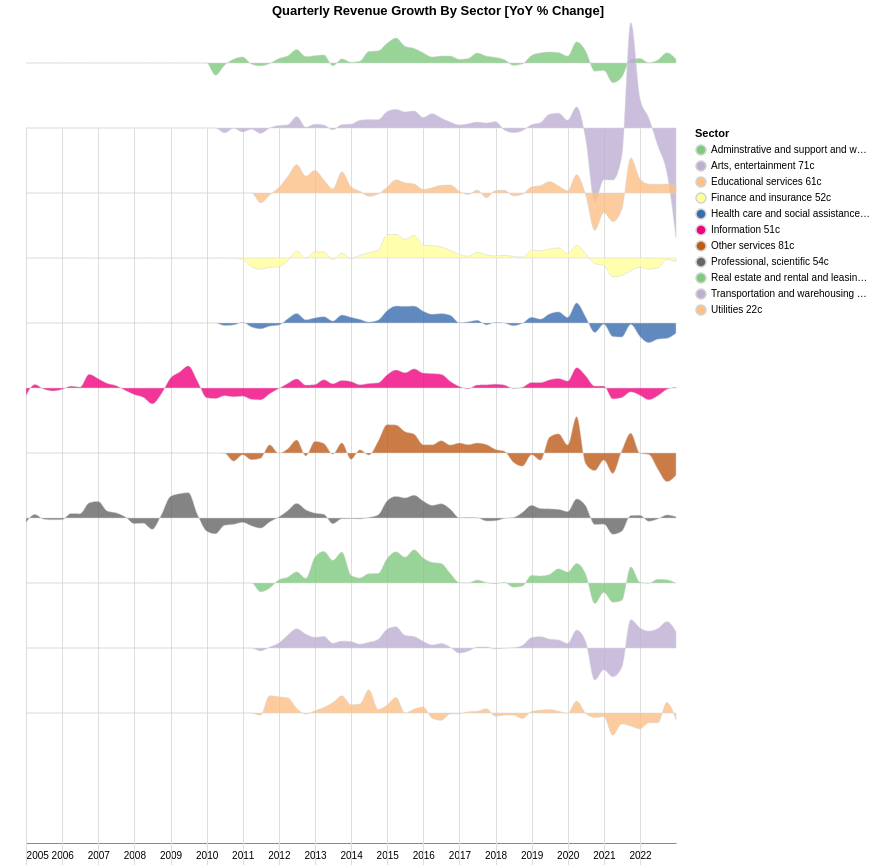
|
Agriculture: Dairy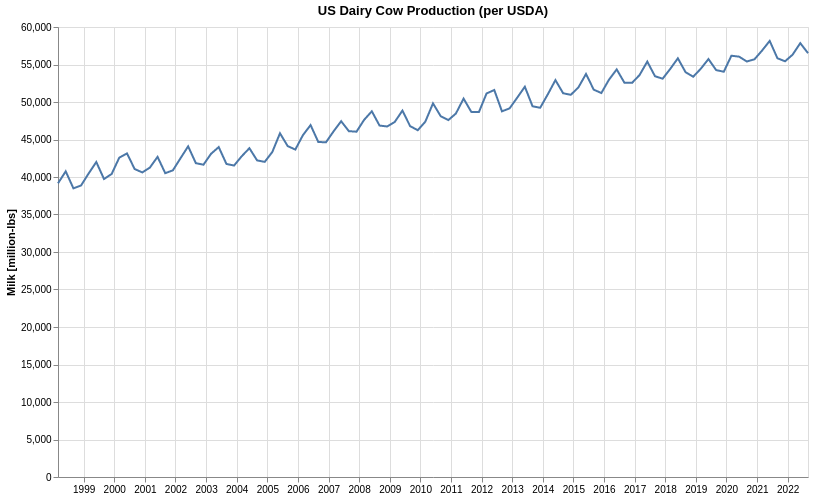
|
|
Electricity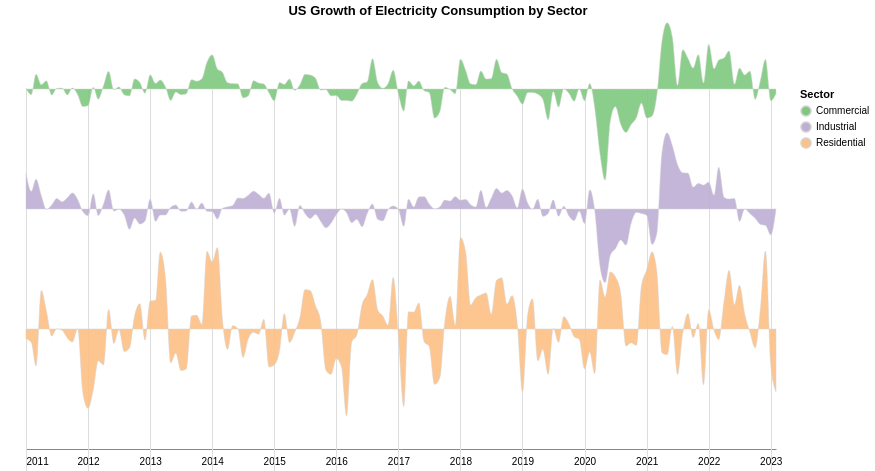
|
Oil and Gas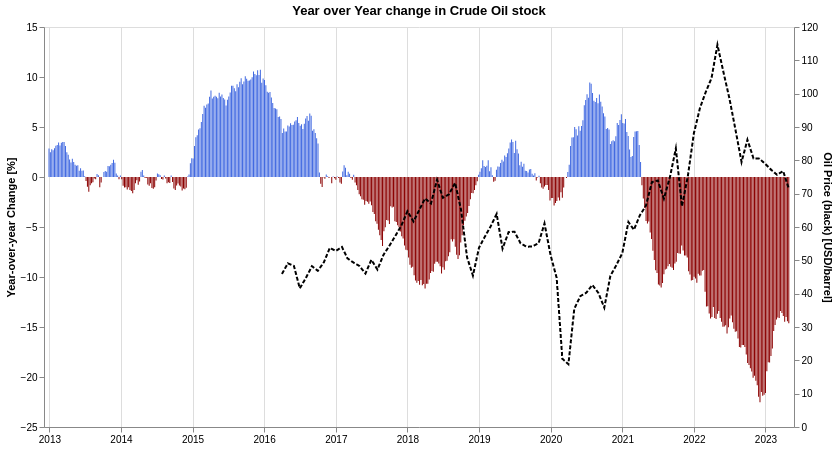
|
|
Automotives
|
Manufacturing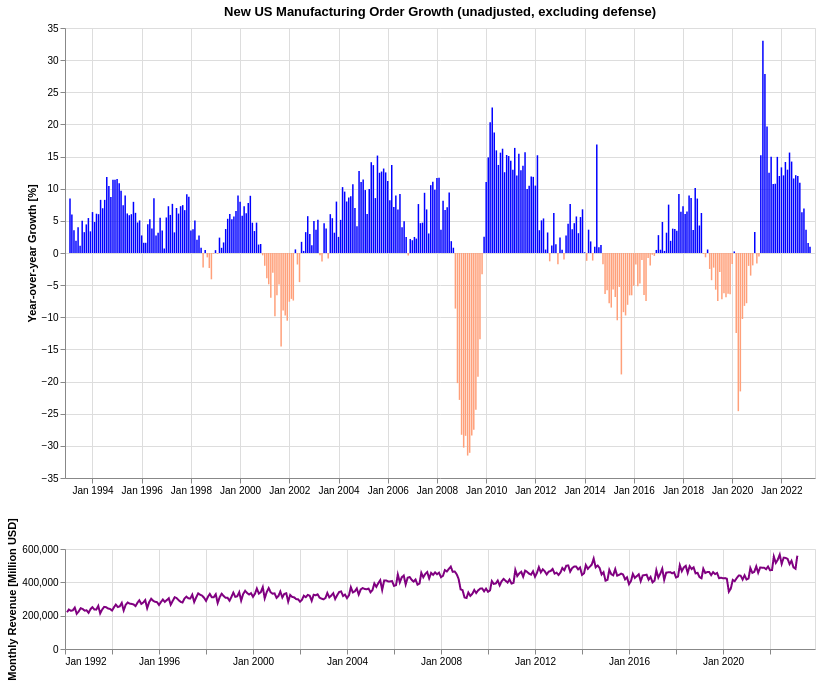
|
|
Seaports |
Railroads |
|
Trucking |
Air & Waterway Freight |
|
Construction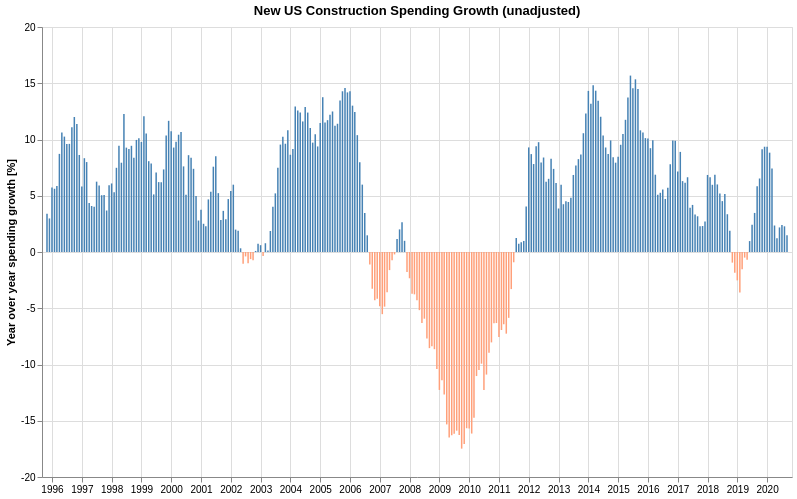
|
Labor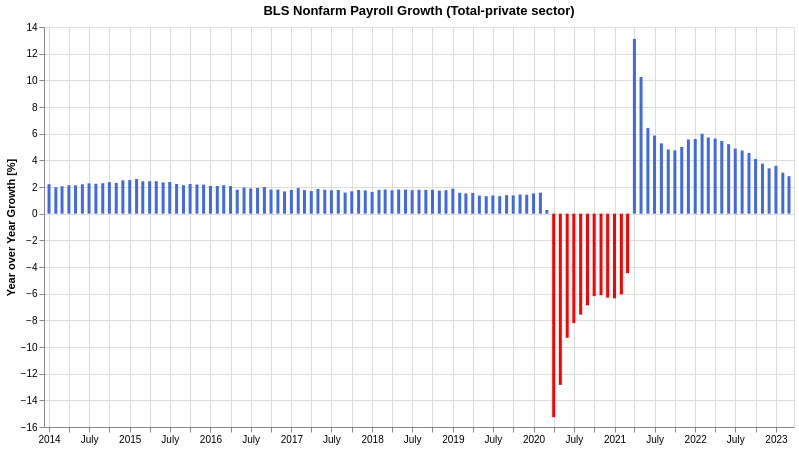
|
|
Real Estate Prices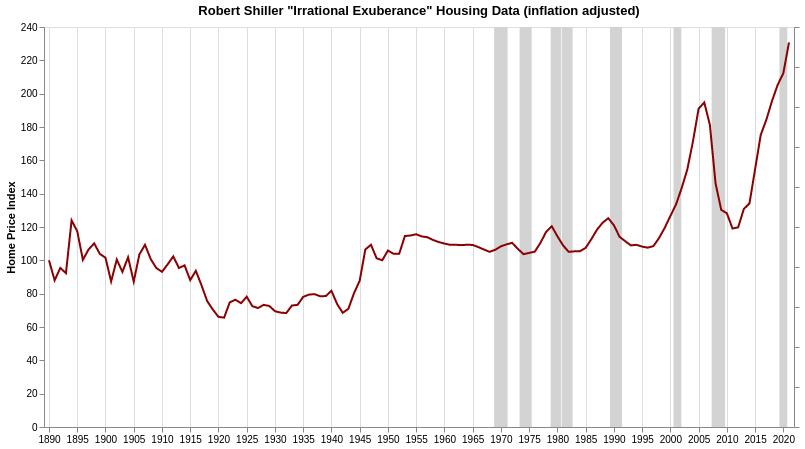
|
Real Estate Sales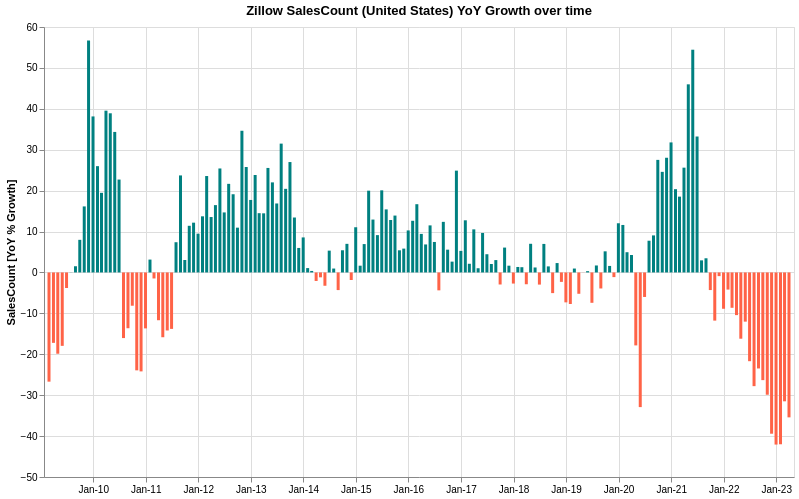
|
|
Trade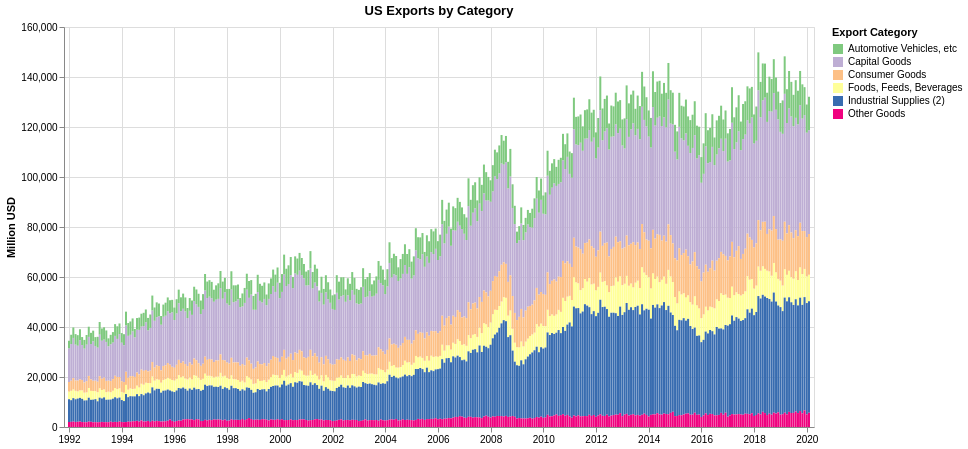
|
Sentiment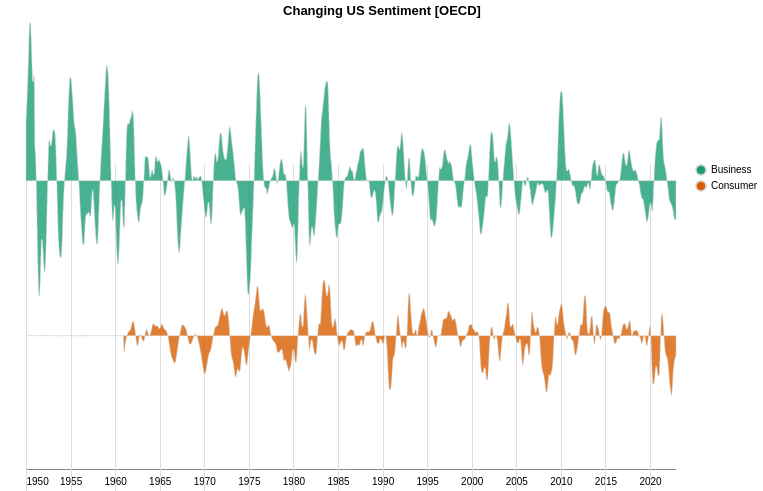
|
|
Stock Market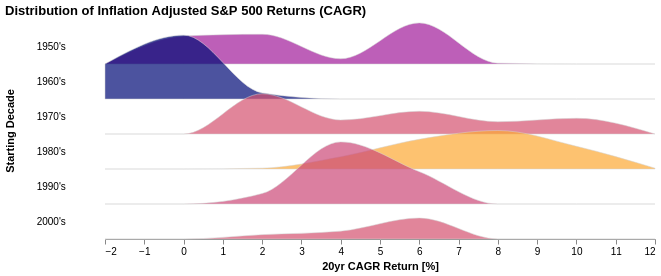
|
Bond Rates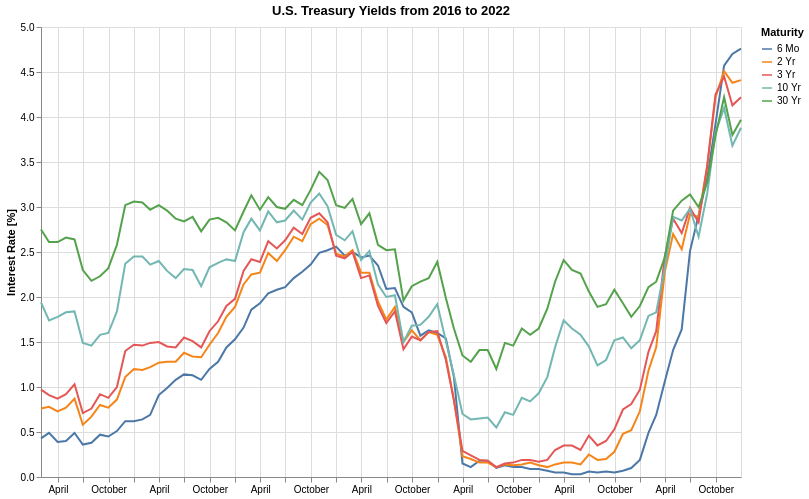
|
|
Bond Auctions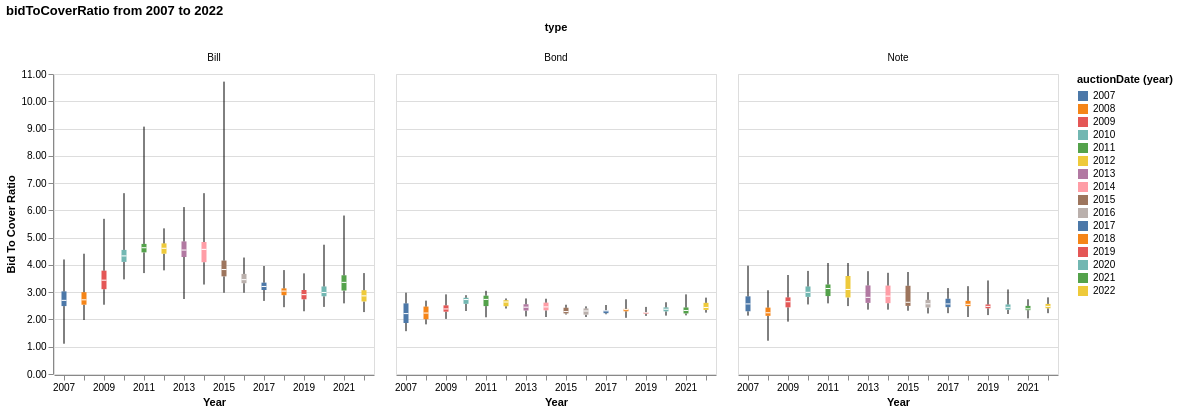
|
Sources
Consumer Spending
Retail Sales Charts - aka "70%" of the US economy
Source: US Census Bureau / Monthly Retail Trade Report
Consumer Credit Card Charts
Sources:
Service Sector
Commercial Charts
Source: US Census Bureau / Quarterly Services Survey
Agriculture Sector
Dairy Charts
Source: U.S. Department of Agriculture
Energy Sector
Electricty Charts
Source: US Energy Information Agency - Monthly Form EIA-861M
Oil and Gas Charts
Source: US Energy Information Agency - Petroleum supply, Natural Gas underground storage
Industrial Sector
Automotive Charts
Source: U.S. Bureau of Economic Analysis
Manufacturing Charts
Source: US Census Bureau / Manufacturers’ Shipments, Inventories, and Orders Report
Transport Sector
Seaport Shipping Charts
Sources (accounting for >80% of US port volume):
- Port of Los Angeles Historical TEU Statistics
- Port of Long Beach TEUs Archive
- Port of New York / New Jersey Monthly Cargo Volumes
- Georgia Ports Monthly TEU Throughput Report
- Port of Houston TEU Container Volume Report
- Northwest Seaport Alliance Cargo Statistics
- Port of Charleston Historical TEU Report
- Port of Virginia Historical Statistics
- Oakland Seaport Monthly Report
Railroad Charts
Sources:
- CSX Freight Reports
- Union Pacific Freight Reports
- Burlington Northern Santa Fe Freight Reports
- Norfolk Southern Freight Reports
Trucking Charts
Source: CASS Transportation Indexes
Air Freight & Waterway Charts
Source: U.S. Department of Transportation - Bureau of Transportation Statistics
Commercial Sector
Construction Charts
Source: US Census Bureau / New Construction
Employment
Labor Market Charts
Source: US Bureau of Labor Statistics / Current Employment Statistics
Real Estate
Residential Price Charts
Source: Case/Shiller Home Price Index
Residential Listings and Sales Charts
Source: Zillow Research Data
International Trade
Census International Trade Charts
Source: US Census Bureau Foreign Trade
Sentiment
OECD Confidence Index Charts
Sources:
Stock Market
Historical Performance Charts
Sources:
Monetary Policy
Treasury Interest Rate Charts
Source: US Treasury Daily Treasury Long Term Rate Data
Treasury Auction Charts
Source: Treasury Direct Security Web API
Federal Reserve Repo Operations (NYI)
Credit Markets (WIP)
Commercial Credit Charts
Source: Federal Reserve Bank of St. Louis - FRED
Credits
The Jupyter notebook website template system used in this work was developed by Peter Carbonetto and Gao Wang at the University of Chicago.
© pymoment